
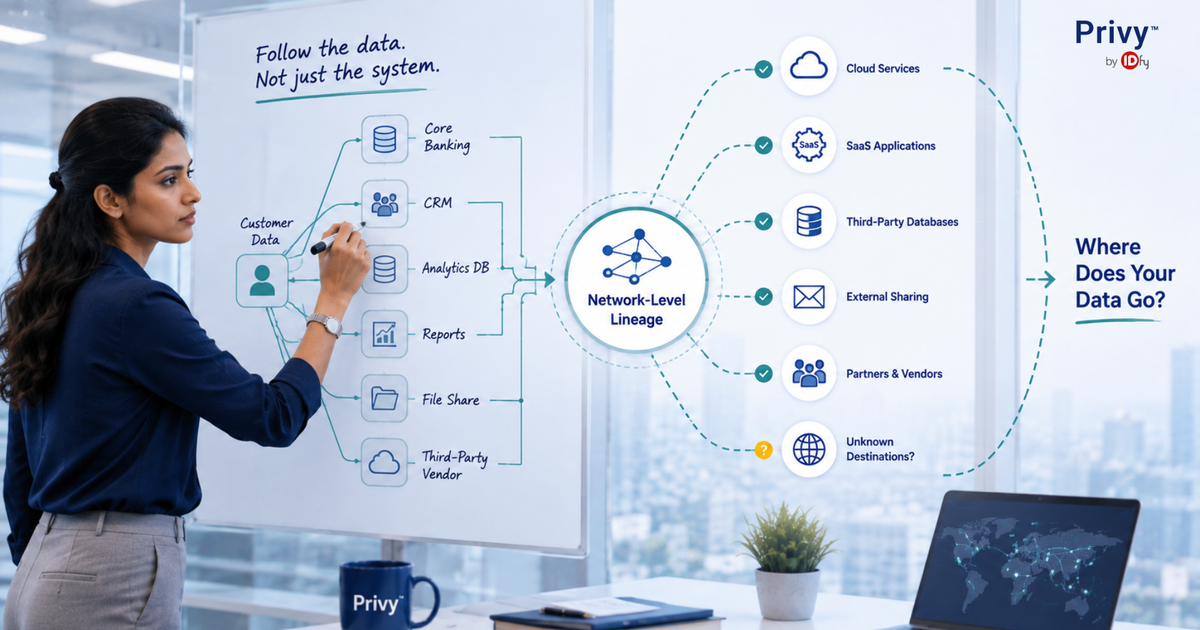
Why Network-Level Lineage Is the Only Approach That Actually Tells You Where Your Data Goes
Most privacy programmes can tell you what data they hold. Very few can tell you where it goes. That second question is the harder one, and under the DPDP Act it is the one that carries the real obligation. A Data Fiduciary is accountable not just for the personal data it collects, but for every place that data flows, every processor that touches it, and every boundary it crosses. So how do you actually see those flows, reliably, across systems you did not write and cannot pause?
The answer starts with rejecting the way most data lineage tools try to answer it. The instinct is to reconstruct data movement from the things systems already produce: application logs, database query records, API gateway traces, configuration files. Gather enough of these exhaust trails, stitch them together, and you get a picture of how data moves. This works well enough in a clean, well-instrumented environment where every service logs faithfully and nothing talks to anything the map does not already know about. It falls apart everywhere else, which is to say it falls apart in production. Tracking data flow is not a logging problem. It is an observation problem, and every approach that treats it as logging inherits the same blind spot, no matter how much telemetry it gathers. To see why, it helps to walk through the three approaches most data lineage tools rely on, in order of increasing sophistication, and understand exactly where each one breaks.
Approach 1: Application Logs: Trusting the System to Report on Itself
The simplest approach to data lineage is to read what the application already writes down. Services emit logs. Those logs mention which downstream systems they called, what they sent, sometimes what came back. Collect the logs, parse them, and build a flow map from what the applications say they did. Log-based lineage has one virtue: the data is already there, so it is cheap to start. It also has one fatal limitation. It only sees what the application chose to record.
What an application log structurally cannot show you:
- The call nobody thought to instrument
- The third-party SDK making its own outbound connections in the background
- The debug endpoint someone left open
- The batch job that copies data at 2 am through a path that predates the logging framework
- Any flow the developer decided was not worth logging
A log tells you what the system believes it is doing. It cannot tell you what the system is actually doing. The gap between those two is exactly where uncontrolled data flows live. For a DPDP programme, where the flows that create liability are precisely the ones nobody documented, log-based lineage is not a foundation. It is a self-assessment dressed up as evidence.
Approach 2: API Gateway and Proxy Tracing: Seeing Only What Passes Through the Gate
The next step up is to stop trusting individual applications and instead watch the chokepoints. Route traffic through an API gateway or a service mesh proxy, and every call that passes through gets recorded consistently, regardless of whether the application bothered to log it. This feels like a real fix for data flow mapping. It is for the traffic that goes through the gate. The problem is everything that does not.
What a gateway cannot see:
- A service making a direct connection that bypasses the mesh entirely
- Calls to an external API over a path the proxy does not sit on
- Communication with a data store through a driver rather than an HTTP endpoint
- A legacy service that predates the mesh and was never rerouted through it
- A data pipeline wired directly to a warehouse outside the gateway perimeter
- An analytics tool phoning home through a channel nobody mapped
These bypasses are not rare edge cases. They are how real systems accumulate over time. A gateway gives you a clean, trustworthy view of a subset of your traffic, and complete silence about the rest. Worse: the silence is invisible. You see the flows through the gate, and you have no signal that other flows exist, so the data lineage map looks complete precisely where it is most dangerous.
Approach 3: Agent-Based Instrumentation: Better Coverage, Same Ceiling
The most sophisticated application-layer approach embeds instrumentation directly into each service. Add an agent, a library, or an SDK, and it reports flows from the inside with far more fidelity than external logs capturing calls the application never explicitly logged. This is where many modern data lineage tools sit, and it is a genuine improvement. The visibility is deeper, and the reporting is more consistent. But it shares the same fundamental flaw as the approaches before it, just hidden under a layer of coverage.
Why agent-based instrumentation still leaves critical gaps:
- Instrumentation only exists where you installed it; every service without the agent is invisible
- Third-party appliances and vendor black boxes typically cannot be modified to carry an agent
- Legacy systems where adding an agent requires a change window that may never get approved
- Containers spun up rapidly without following the standard instrumentation process
- Every application team must carry, update, and not break the instrumentation, indefinitely
The services that do not carry the agent are always the ones you least control. And they are precisely the ones that matter most for DPDP accountability: the external processors, the legacy integrations, the third-party tools whose flows you are most responsible for but least able to instrument. The sophistication masks the problem. You have deeper reporting, but only from the systems that agreed to report.
The Common Thread: All Three Depend on the System's Cooperation
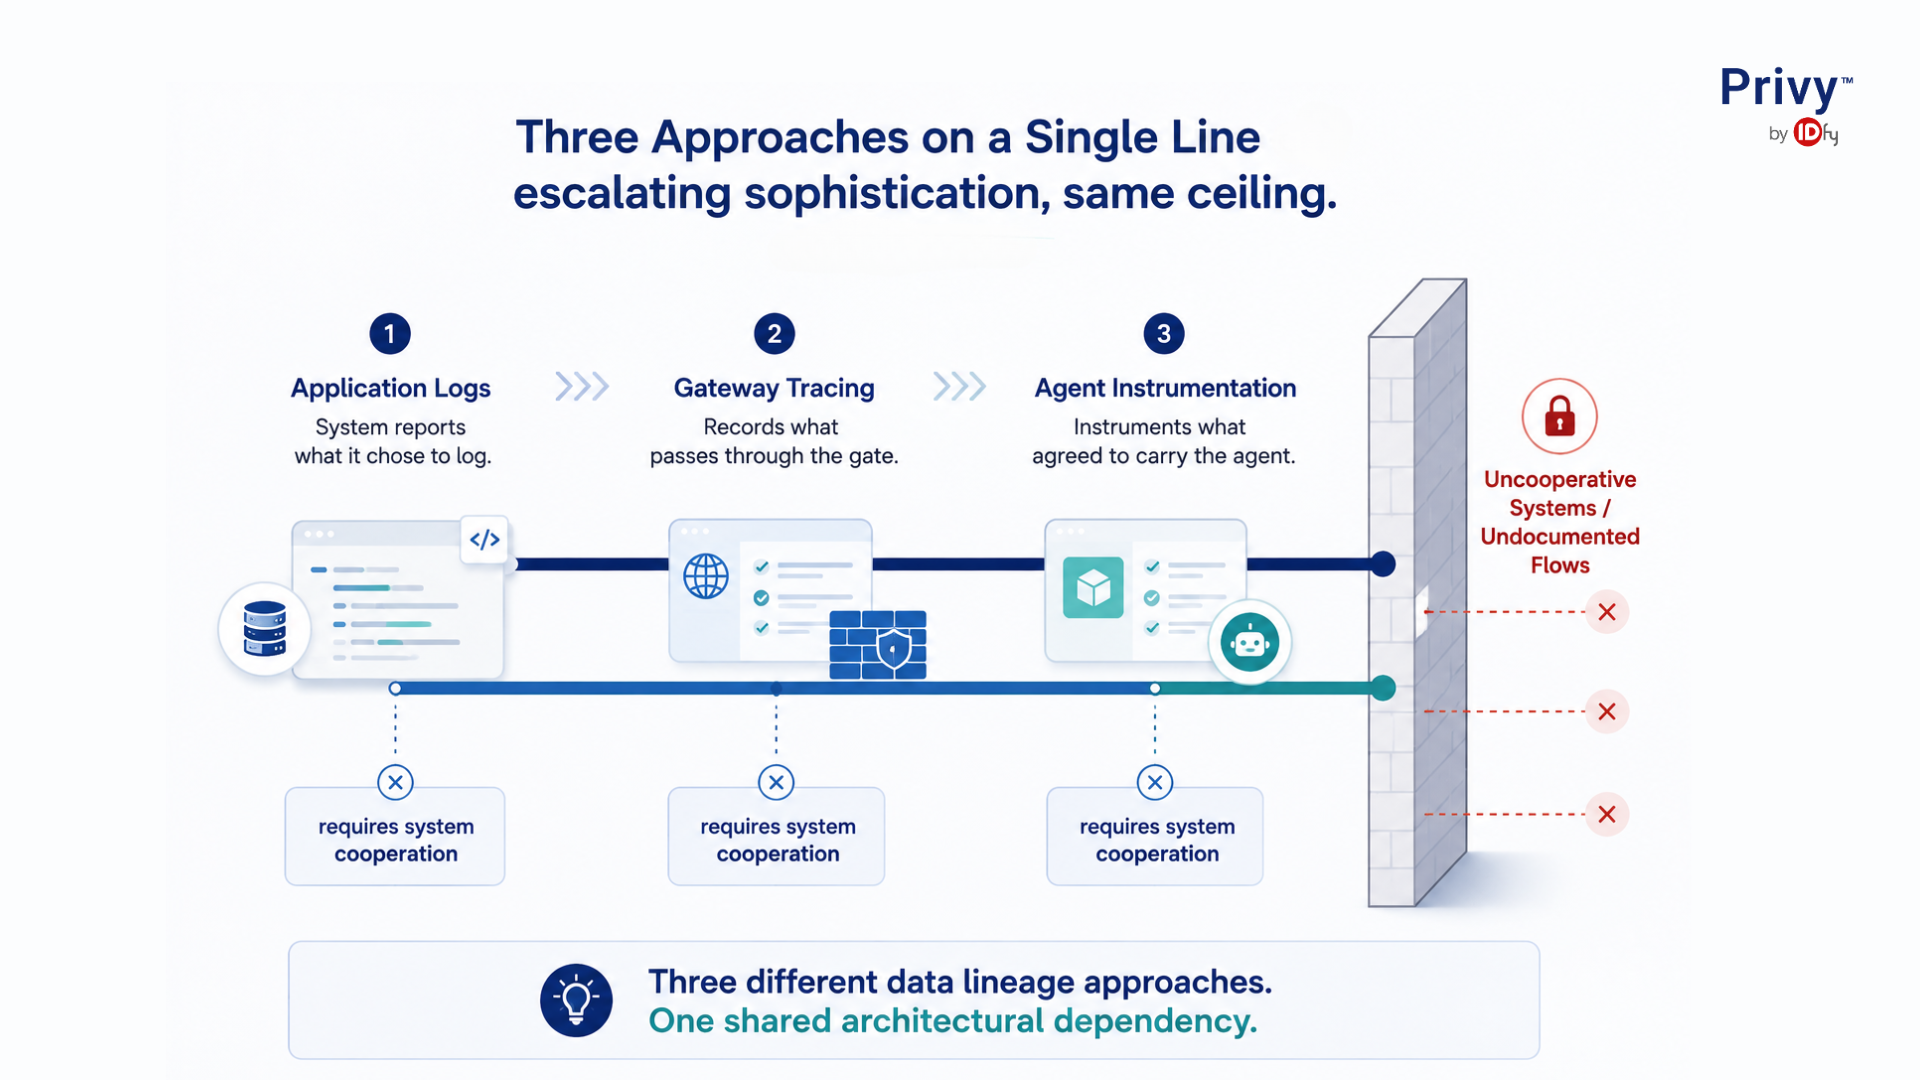
Step back and look at these three data lineage approaches together, and the pattern becomes clear. Application logs, gateway tracing, and agent instrumentation are not three different solutions. They are three points on a single line, each a more sophisticated version of the same underlying mistake.
That mistake: they all depend on the observed system cooperating with being observed. The application has to log the call, route it through the gate, or carry the agent. Observation happens at the application layer, which means the application or whoever configured it gets to decide what is visible.
The structural consequence for DPDP compliance:
- The flows you can see are the flows something chose to expose
- The flows that create DPDP liability are, by definition, the ones nobody chose to expose
- If they had been deliberately accounted for, they would already be in the data map
This is why every application-layer approach to data lineage hits the same ceiling. You cannot build a trustworthy map of data movement using a method that only shows you the movement someone already decided to reveal. The blind spot is not at the edges. It is structural.
What Kernel-Level Observation Actually Means
Kernel-level observation is a different starting point entirely. Instead of asking each application to report its flows, you watch the one layer every flow has to pass through regardless: the operating system kernel. Every network connection a service makes, regardless of language, framework, or whether anyone instrumented it, goes through the kernel. The kernel handles the socket. It sees the connection being opened, the destination, the process making the call.
Why this changes everything:
- True for the well-behaved microservice and the undocumented legacy job alike
- Neither can reach the network without going through the kernel first
- There is no bypass; the kernel is not a gate you route around; it is the floor everything stands on
- The application cannot choose whether to be observed, because the observation happens below the application layer entirely
The difference is not incremental. It is categorical. An application-layer data lineage tool asks: what did the systems report doing? A kernel-level approach asks: what actually happened on this machine, whether the application admitted it or not? The first question can only ever return what was volunteered. The second returns what is real. The technical question then becomes: how do you observe the kernel safely, at scale, across production machines, without rewriting the kernel or destabilising the systems you are watching? This is where eBPF comes in.
Why eBPF Is the Right Technology for This
eBPF is a capability the Linux kernel itself exposes: a way to run small, sandboxed, verified observation programmes inside the kernel, safely, without modifying kernel source and without restarting anything. It is the technical realisation of everything kernel-level data lineage and data observability demands. Where an agent-based pipeline asks each application to carry instrumentation, an eBPF probe attaches to the kernel's own network hooks and observes every connection from underneath in one place, for every process on the machine at once.
What an eBPF probe observes per connection, without touching application code:
- The four-tuple identifying the connection (source, destination, ports, protocol)
- The destination hostname, resolved from the TLS handshake's Server Name Indication
- The process making the call
- All of the above, for every process on the machine, simultaneously
It does this without a proxy, without a sidecar, and without decrypting a single payload. It reads the metadata of the flow, not its contents.
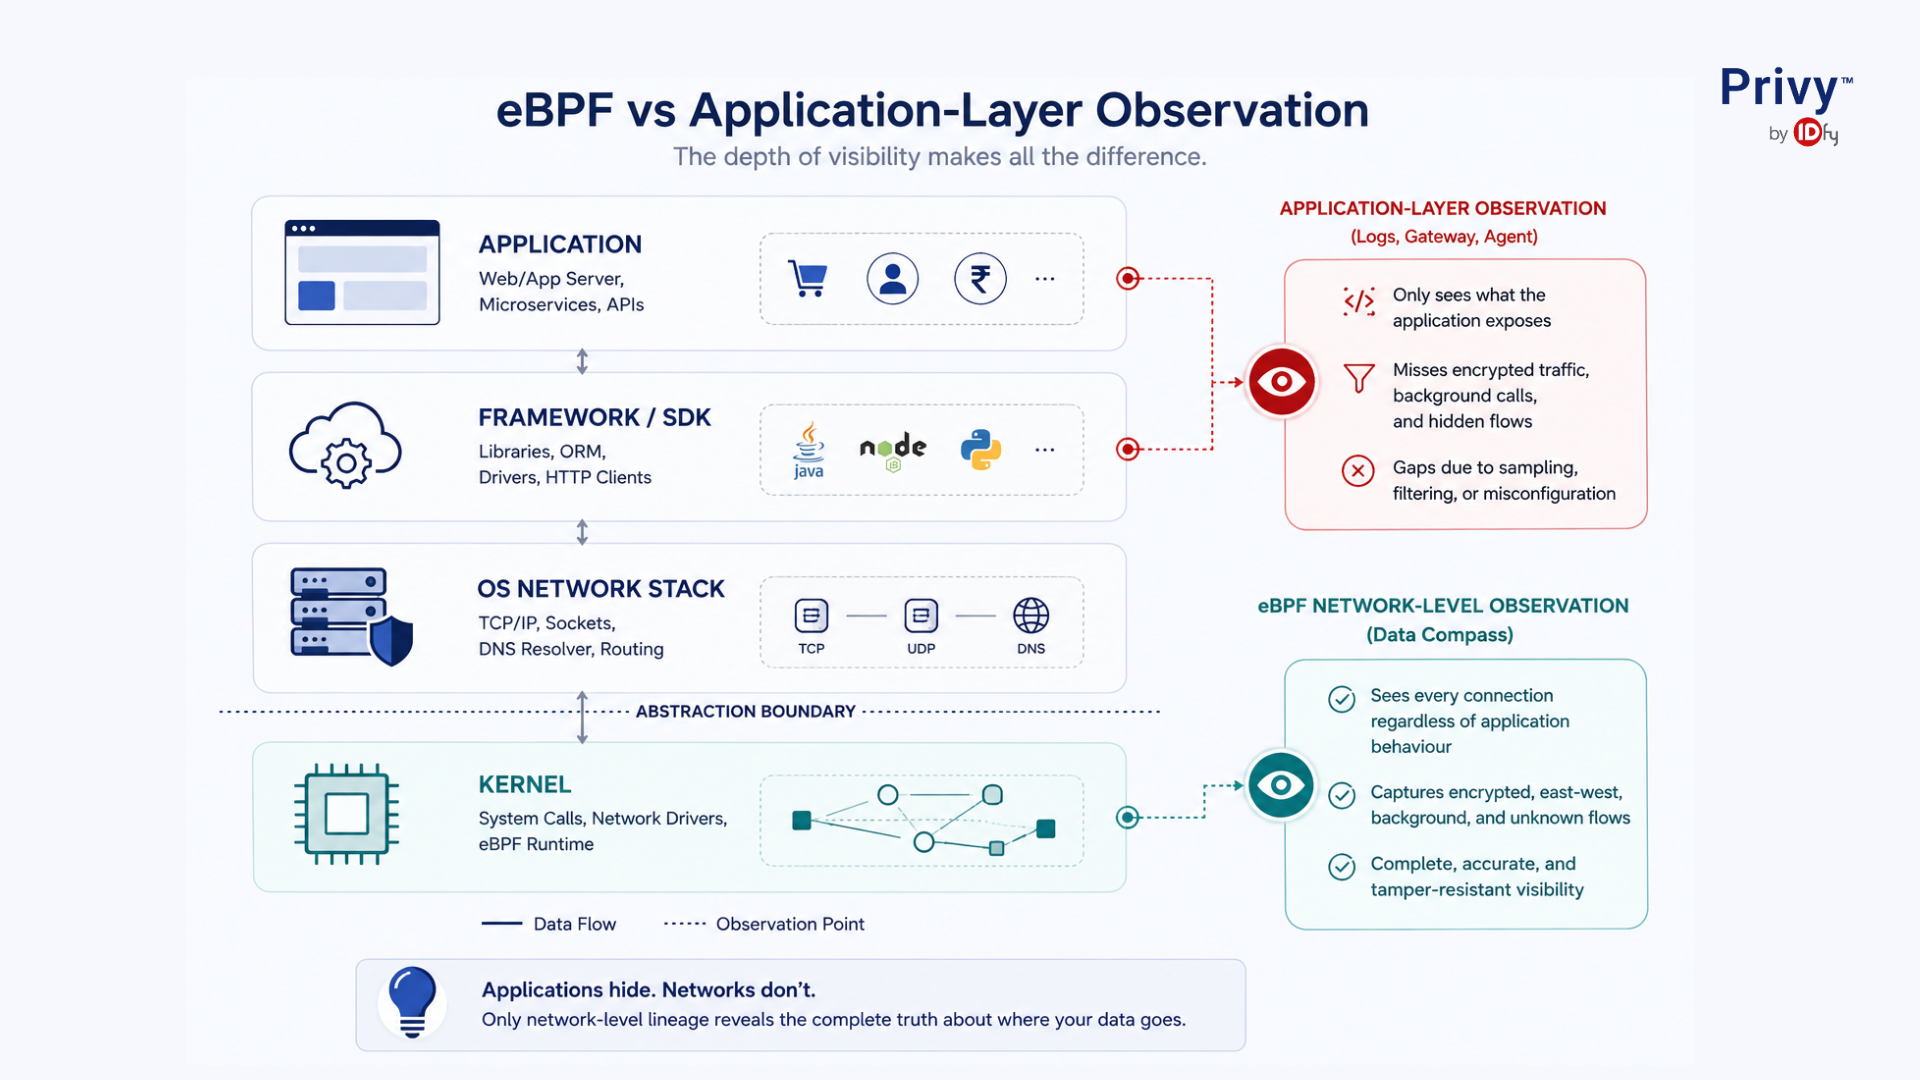
This is why eBPF is the right approach for this problem. It does not ask the system to cooperate with being observed, because it observes from a layer the system cannot route around or opt out of. The undocumented flow, the agentless legacy box, the third-party SDK phoning home all of them cross the kernel, and all of them are therefore visible. For a DPDP data lineage problem where the answer lives in the flows nobody chose to expose, this is not one option among several. It is the only class of technology that operates on the layer where every flow is forced to appear.
How Data Compass Is Built for This
Data Compass includes eBPF-based auto lineage, built for the reality that the flows creating DPDP liability are exactly the ones no application will report on itself. Because it observes at the kernel, it captures the failure cases that defeat every application-layer approach.
Walk through the four failure cases, and the difference is clear in each one:
Undocumented and shadow flows: When a service makes a connection nobody logged, routed around no gateway, and carried no agent, application-layer tools see nothing. Data Compass sees the connection because it crossed the kernel, so an unaccounted-for flow becomes a visible finding rather than a silent gap in the map.
Agentless and unmodifiable systems: When a legacy appliance or a third-party black box cannot take instrumentation, agent-based lineage simply has no coverage there. Data Compass needs nothing installed inside those systems; it observes their traffic from the kernel of the host, so the boxes you cannot change stop being blind spots.
Cross-border and residency movement: When personal data that must stay in India is replicated to another region or accessed from outside an approved zone, that movement is a network flow, and Data Compass sees it at the kernel. Assets can be mapped to India-only residency requirements under the DPDP Act, with alerts when observed flows cross a boundary they should not, and exceptions handled through policy rather than guesswork.
Processor and third-party visibility: When data leaves for an external processor, the eBPF probe resolves the destination from the TLS handshake and names the counterparty without decrypting anything, giving the Data Fiduciary a real view of which processors actually receive data, rather than which ones a spreadsheet claims to.
In every case, the pattern is the same. The application-layer approach fails because it depends on the system to reveal the flow. Data Compass succeeds because it observes the layer where the flow cannot hide. One honest boundary worth stating: this is flow-level lineage network movement between systems, not SQL-parse-level lineage inside a database. It tells you that data moved between these systems, across this boundary, to this processor. It does not trace column-to-column derivation inside a query. For the DPDP questions that carry the real liability where did personal data go and who received it flow-level is the layer that matters.
To understand where data lineage fits in the broader picture of what DPDP accountability requires, the DPDP compliance guide for 2026 is a useful reference for how lineage connects to consent, rights management, breach scoping, and processor obligations. For BFSI organisations specifically, where data flows to external processors, BC agents, and analytics vendors create the highest residency and processor accountability risks, the DPDP readiness guide for banks covers how third-party oversight and data flow visibility fit into the compliance programme.
The Right Question for Evaluators
If you are evaluating a data lineage tool, the instinct is to ask how many data sources it connects to, how rich its visualisations are, and how many integrations it ships with. These are questions about the wrong layer. The question that actually determines whether a tool will tell you the truth about your data flows is simpler.
Does it observe what the systems actually do, or does it only report what the systems chose to reveal?
Every tool built on application logs, on gateway tracing, or on embedded agents answers that question the same way. It reports what was volunteered, and it goes silent exactly where nobody volunteered anything. For a clean, fully instrumented, cooperative environment, that can be enough. For the real, messy, agentless, undocumented reality of production systems handling personal data, it is not, and no amount of coverage layered on top of application-layer reporting changes the answer, because the blind spot is built into where the observation happens, before any of the telemetry-gathering sophistication gets a chance to apply. Data Compass answers the question differently because it observes differently. It sees what actually crossed the wire. For DPDP accountability, that is not a feature. It is the whole game.
Conclusion
Data lineage for DPDP compliance is an observation problem before it is a tooling problem. The three dominant approaches, application logs, gateway tracing, and agent instrumentation all share the same structural limitation: they depend on the system cooperating with being observed. The flows that matter most for DPDP liability, the undocumented ones, the cross-border ones, the processor-bound ones, are precisely the ones no application will volunteer.
Kernel-level eBPF observation does not make that request. It watches the layer every flow crosses regardless, and returns a data lineage map built on what actually happens in production, not what systems say happens. To see how Privy by IDfy handles the flow visibility gaps in your environment, write to shivani@idfy.com to book a walkthrough.
FAQ's
What is data lineage and why does it matter under the DPDP Act?
Data lineage is the ability to track how personal data moves across systems from where it is collected, through every transformation and transfer, to every processor and destination it reaches. Under the DPDP Act, a Data Fiduciary is accountable for every place personal data flows, every processor that handles it, and every boundary it crosses. Without accurate lineage, a fiduciary cannot demonstrate that accountability, cannot scope a breach correctly, cannot validate that processors are handling data within contracted terms, and cannot identify when data is crossing a residency boundary it should not. Data lineage is not a reporting feature. It is the evidentiary foundation for the DPDP obligations that carry real penalties.
Why do application logs fail as a data lineage approach?
Application logs are a self-report. They capture the calls the developer decided to log, in the format and verbosity they chose. They say nothing about the call nobody instrumented, the third-party SDK making its own outbound connections, the batch job running on an undocumented schedule, or the debug endpoint left open after a testing cycle. The flows that create DPDP liability are precisely the ones nobody documented because if they had been accounted for, they would already be in the data map. Log-based lineage only covers the intersection between what actually happens and what the system chose to report.
What is eBPF and why is it the right technology for data flow observation?
eBPF is a Linux kernel capability that allows small, sandboxed observation programmes to run inside the kernel safely, without modifying kernel source code and without restarting systems. Because every network connection a process makes goes through the kernel, an eBPF probe can observe all connections from a single vantage point for every process on the machine, simultaneously. It captures the destination, the process, and the connection metadata from the TLS handshake without decrypting any payload. Unlike agent-based approaches that require instrumentation per service, eBPF operates below the application layer, so it observes flows the application never chose to expose.
What is the difference between flow-level and SQL-level data lineage?
Flow-level lineage tells you that data moved between two systems, across a specific boundary, to a specific external party. It answers the questions that carry DPDP liability: where did personal data go, which processor received it, did it cross a residency boundary, was the movement expected. SQL-level or column-level lineage traces how specific data fields are derived inside a query within a database system; it is a data engineering tool for understanding transformation logic. Both have their uses, but for DPDP processor accountability and residency obligations, flow-level is the relevant layer.
Does Data Compass require agents installed on every system?
No. Data Compass uses eBPF-based observation at the kernel level, which means it does not require agents, SDKs, or code changes inside the systems being observed. This is the architectural point that matters for DPDP compliance: the systems where agent installation is impossible, legacy appliances, third-party black boxes, and vendor integrations are exactly the ones most likely to carry unexamined personal data flows. Kernel-level observation covers those systems because it observes from the host, not from inside the application.
Search Here
Explore More

May 18, 2025
PII Data demystified

Apr 27, 2026
Data Minimization in DPDP: Why Collecting Less Data is the Smartest Strategy in 2026
Share




 shivani@idfy.com
 Unit no. 801, Skyline Icon, 804, Andheri - Kurla Rd, Chimatpada, Marol, Andheri East, Mumbai, Maharashtra 400059
 1800 123 4339